
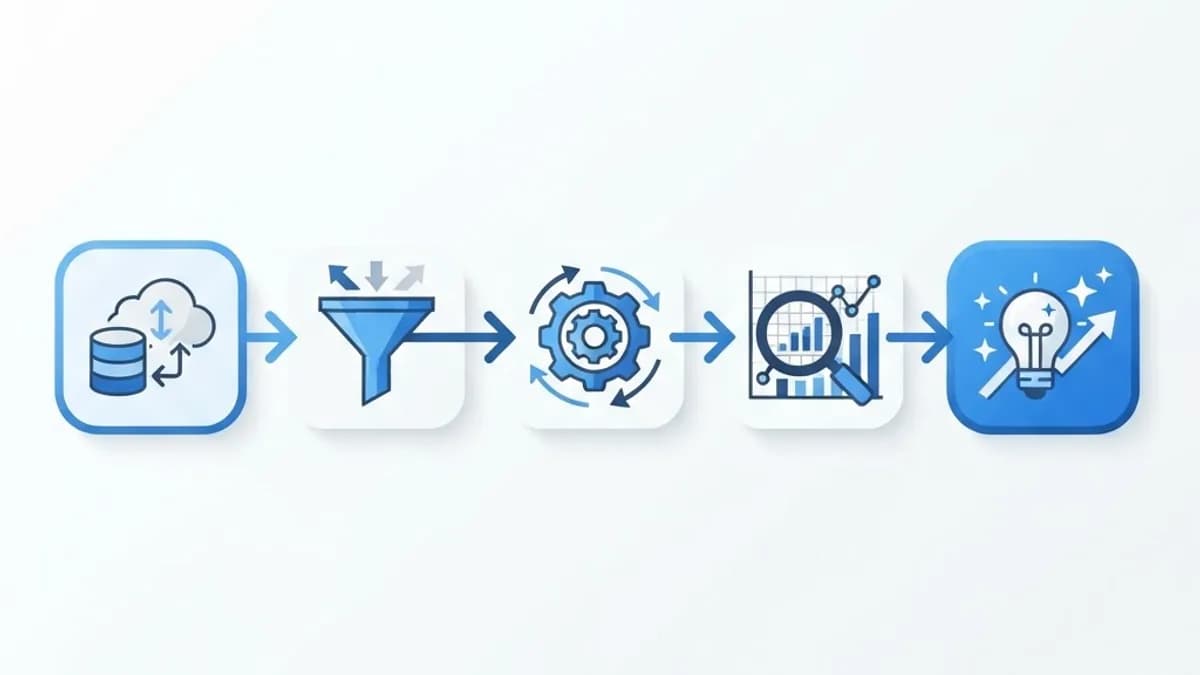
Every organisation that gets value from data follows some version of the same path. It is rarely documented, often improvised, and almost always the difference between insight and expensive confusion.
That path is the analytics process: a repeatable sequence that takes a business question, gathers the right data, examines it properly, and ends with a decision someone actually makes. Skip a step and you get beautiful charts nobody uses.
This article lays out the full process, who runs it, where it breaks, and how to make it work in a real company rather than a textbook.
What Is the Analytics Process?
The analytics process is the structured workflow analysts use to convert raw data into evidence-based action. It typically covers defining the question, collecting data, cleaning it, exploring it, modelling or analysing it, and communicating results.
The critical idea is that analysis is a loop, not a line. Findings raise new questions, questions require new data, and new data changes earlier assumptions. Teams that treat it as a one-way pipeline usually deliver answers to questions nobody asked anymore.
Different frameworks name the stages differently — CRISP-DM, the OSEMN model, or an internal playbook — but the underlying logic is consistent across all of them.
Who Uses the Analytics Process?
Anyone who has to justify a decision with numbers ends up using it, formally or not.
- Data analysts and BI teams running recurring reporting and ad-hoc investigations.
- Product managers validating whether a feature actually improved retention.
- Marketing teams attributing conversions and testing creative, often supported by data-driven digital marketing services that supply campaign-level metrics.
- Finance and operations staff building forecasts and variance analyses.
- Founders and small business owners deciding where limited budget goes next quarter.
Key Stages of the Analytics Process
Framing the Question
The most under-invested stage. A vague brief like "analyse our sales data" produces vague output. A sharp one — "which acquisition channel produces customers with the highest 12-month value?" — defines the data, the method and the deliverable in a single sentence.
Data Collection and Integration
Data usually lives in several systems: a CRM, a payment processor, analytics tags, a spreadsheet someone maintains manually. Bringing these into one queryable place is what makes cross-channel questions answerable at all.
Cleaning and Preparation
Duplicate records, inconsistent country codes, currency mismatches, timestamps in three time zones. This stage routinely consumes 60–80% of project time and determines whether every later step is trustworthy.
Analysis and Interpretation
Here you look for distributions, trends, correlations and segments. The skill is not running the calculation — software does that — but knowing which comparison is fair and which is misleading.
How to Run the Analytics Process Step by Step
Follow the order deliberately. Most disasters come from jumping straight to charts before anyone agreed what question was being answered.
- Define the business question and success metric. Write down what decision the answer will inform.
- Identify and gather data sources. Note gaps and how far back reliable history goes.
- Clean, validate and document. Record every transformation so results can be reproduced.
- Explore the data. Check distributions, outliers and obvious data-entry errors before modelling anything.
- Analyse or model. Apply the simplest method that answers the question adequately.
- Communicate and act. Present findings with clear recommendations, then track whether the resulting decision worked.
Benefits of a Defined Analytics Process
Structure sounds bureaucratic until you have watched an unstructured team redo the same analysis three times.
- Reproducibility. Anyone can rerun the analysis next quarter and get the same numbers.
- Faster delivery. Reusable cleaning steps and documented sources cut ramp-up time dramatically.
- Higher trust. Stakeholders stop questioning the figures when the method is transparent.
- Fewer wasted projects. Framing the question first kills low-value requests early.
- Easier onboarding. New analysts learn the pipeline instead of reverse-engineering tribal knowledge.
Potential Challenges
The analytics process fails in predictable ways, and almost none of them are about statistics.
- Fragmented data ownership. Nobody can grant access to the one table you need.
- Shifting requirements. The question changes mid-project because it was never written down.
- Confusing correlation with causation. Two metrics moving together becomes a strategy with no experimental evidence.
- Poor presentation. Solid analysis buried in a 40-slide deck nobody finishes reading.
Best Practices and Tips
Small process disciplines produce outsized reliability gains.
- Write a one-page brief before touching data, and get the stakeholder to approve it.
- Automate the repetitive stages — extraction and cleaning — so human effort goes into interpretation.
- Keep a data dictionary defining every metric, because "active user" means four different things across departments.
- Lead with the recommendation, then show supporting evidence. Executives read top-down.
Real-World Example
A regional ecommerce retailer believed its email channel was underperforming and considered cutting the budget. Rather than acting on the dashboard, the analyst ran the full process. The question was reframed as: "what is the 90-day revenue per recipient by campaign type?"
Collecting data meant joining the email platform export with order records — and the join revealed the problem. Roughly 18% of orders from email traffic were being attributed to "direct" because a tracking parameter was stripped on mobile. After cleaning and re-attributing, email moved from the fourth-best channel to the second. The budget was increased rather than cut, and the tracking fix was rolled into the site during routine website maintenance and support work. The insight came from stage three, not from a clever model.
Why It Matters
Data volume keeps growing, but decision quality does not automatically follow. A disciplined analytics process is what converts volume into judgement, and it is also what protects a business from confidently acting on a broken number.
It also scales. Once the pipeline is documented and partly automated, adding a new question is incremental work rather than a new project from scratch — especially when reporting is delivered through a purpose-built dashboard from custom web application development instead of manual spreadsheet updates.
Frequently Asked Questions
How many steps are in the analytics process?
Most frameworks use five to seven. The common core is: define the question, collect data, clean it, analyse it, and communicate results. The exact count matters less than covering each function.
Which stage takes the longest?
Data collection and cleaning, almost always. Practitioners commonly report it consuming 60–80% of total project time, which is normal rather than a sign of inefficiency.
Is the analytics process different for machine learning projects?
The early stages are nearly identical. ML projects add feature engineering, model training, validation and ongoing monitoring after deployment, but they still begin with a clear question and clean data.
Do small businesses need a formal process?
Yes, though a lightweight version. Even a written one-page brief and a documented data source list prevents most repeated-work and mistrust problems.
Conclusion
The analytics process is unglamorous and it works. Frame the question, gather and clean carefully, analyse honestly, and present so a decision follows. Teams that respect the sequence spend less time defending numbers and more time using them.
If your reporting still lives in scattered spreadsheets, consider professional web development services to build the connected data layer your analytics process deserves.
Enjoyed this article? Share it with others!